|
Thank you for taking the time to read this proposal. I am a longtime fan of The Refill Shoppe; its Ventura location is near and dear to me and I am a supporter of the brand’s eco-friendly goal of “Making a difference, one bottle at a time.” For those unfamiliar with your work, I encourage them to visit your website, and to learn more about The Refill Shoppe’s history and accolades. As simple living and waste-free initiatives gain more ground, I’m sure The Refill Shoppe enjoys a healthy, loyal following of likeminded customers who look forward to refilling their soaps and shampoos at your Ventura storefront. But I believe The Refill Shoppe’s mission can be more effectively spread through online advertising. Your main customer demographic is comprised of eco-conscious millennials, as well as the late 30s to 40s crowd. The majority of these customers prefer to do their shopping online. In fact, Clickz.com reports that shoppers searching for personal care, baby care, clothing, home decor, and home electronics products divide their shopping fairly evenly between physical stores and e-commerce sites. Why not meet your customers’ needs in both places? 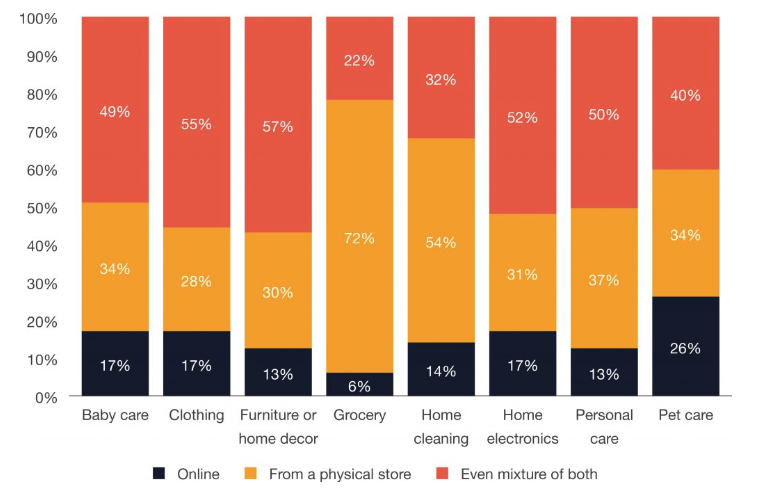 Logistically, you can’t (or at least shouldn’t) sell your soaps and other liquid products over the Internet, but you can advertise, sell, and ship your more durable and alternative lifestyle-centric products (i.e.refillable glass bottles, bath salt sets, silicon storage bags, dishware, etc.) to customers as a vendor or seller through Amazon.com. Using Michael Erickson Facchin’s SEMrush article, “What is Amazon PPC?: A Complete Beginners Guide to Optimization,” I will first break down the basic differences between selling your products as a Vendor versus as a Seller through Amazon: Vendor First-party sellers (typically bigger businesses) sell their products in larger quantities directly to Amazon.com. Amazon then sells these products under their own brand. Vendors also have the opportunity to decide how they wish to advertise to potential customers. Seller Sellers, or third-party sellers, control how their products are viewed by customers and can manage their own orders without Amazon’s help. Seller Central is geared towards small businesses or individual sellers that want to sell directly to customers (rather than through Amazon) via Amazon Marketplace. Below is an infographic from SEMrush outlining the main differences between being a Vendor and Seller on Amazon. 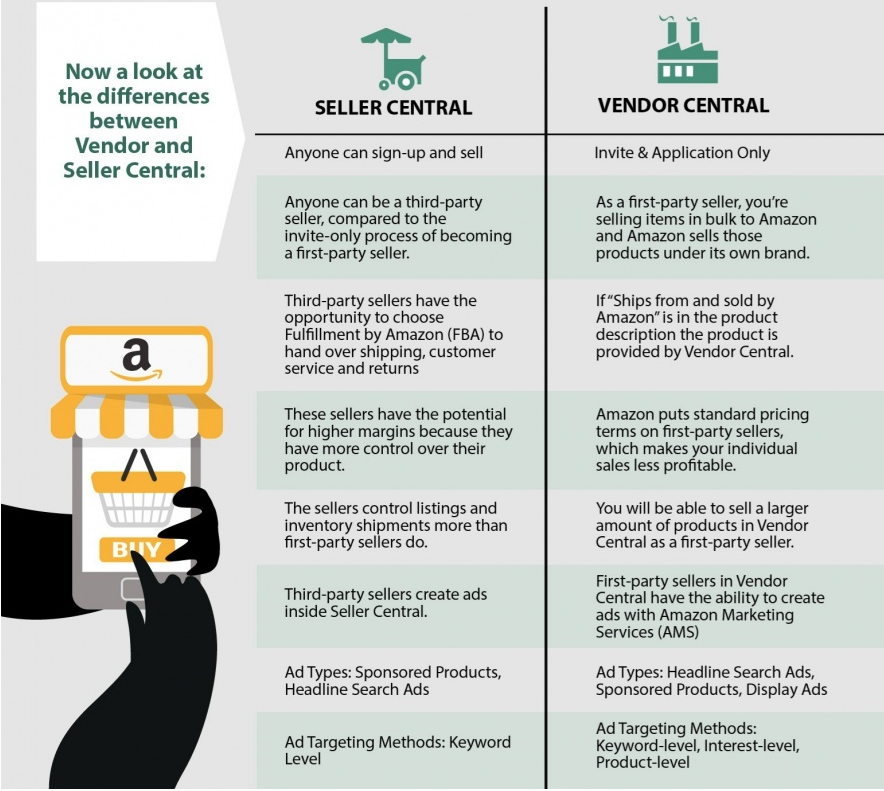 I recommend that as a small, niche business, The Refill Shoppe take advantage of the Seller Central category when listing and selling its products on Amazon. Allow me to tie this in with Amazon’s pay-per-click (PPC) advertising feature. The above referenced SEMrush article explains what PPC is and why it is beneficial for your business: “PPC advertising is advertising you pay for to show up on Amazon to increase the visibility of your product … Like Google Ads, Amazon PPC is a bidding system where the seller bids on search terms in hopes to appear for them on the Amazon search results page (SERP).” In other words, sellers that use Amazon’s PPCs pay for each time a prospective customer clicks on the ad. There are three primary categories of PPC ads used on Amazon: Sponsored Product Ads - These ads usually appear to the right-hand side of the screen before organic search results Headline Search/Banner Ads - These are visible at the top of search results Product Display Ads - Available only to Vendors, these types of ads are placed on product pages that vendors choose Before jumping into PPC ads, be sure your product descriptions are accurate (lest you experience bad customer reviews), provide high-quality images of each product, and ensure your prices are competitive. To optimize your business’s Amazon ranking, research keywords that will most likely draw visitors to your products. Cast a wide net. Depending on the product you’re selling, you’ll want to bid on keywords or phrases like “refillable,” “eco-friendly,” “refill,” “bottle,” “jar,” “reusable,” etc. You can also optimize your search terms by providing descriptive words, again, depending on your product. The success of a Amazon PPC campaign boils down to the cost-per-click compared to how many sales a company makes. This is called conversion rate. According to SEMrush, the average conversion rate among Amazon sellers is 9.67%, while the average cost-per-click on an ad is about 78 cents. As long as the cost of running ads doesn’t cancel out the revenue or make the ads not worth pursuing, you’ll be able to see a return on investment (ROI). Two special conversions to look out for are micro and macro conversations. For The Refill Shoppe, a micro conversion (steps a user takes that bring them closer to making a purchase) can include clicking an ad, visiting a product page, and putting said item into their shopping cart. A macro conversion (the actual purchase of a product) happens when they finish their order. Here is a brief example of similar sustainable companies with goals that match The Refill Shoppe’s who’ve taken advantage of display ads: 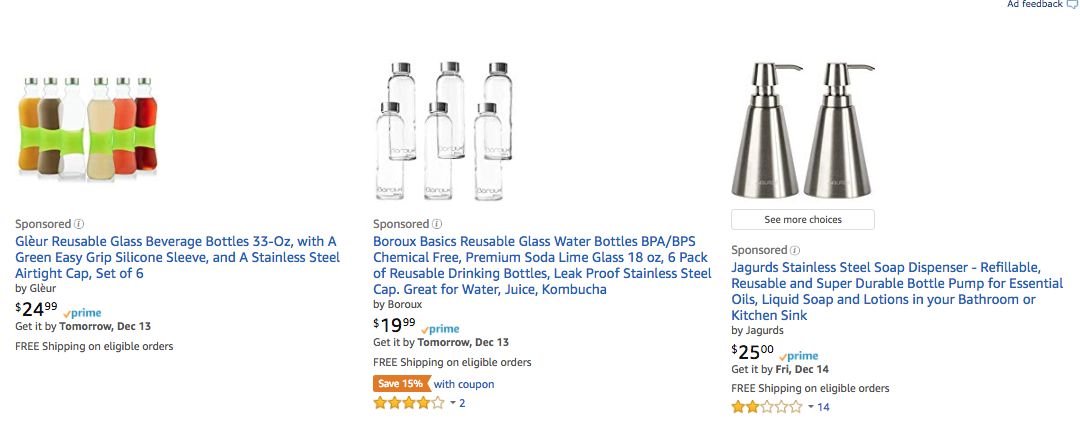 When I type “reusable soap bottles” into Amazon’ search bar, there are sponsored ads from Gleur, Boroux, and Jagurds, all brands that offer products that are similar to what I’m looking for. Although it’s true I might’ve found these products on my own by clicking through product page after product page, having a time-saving ad appear on the first page will make me more likely to look at the product in the ad and put it in my cart. 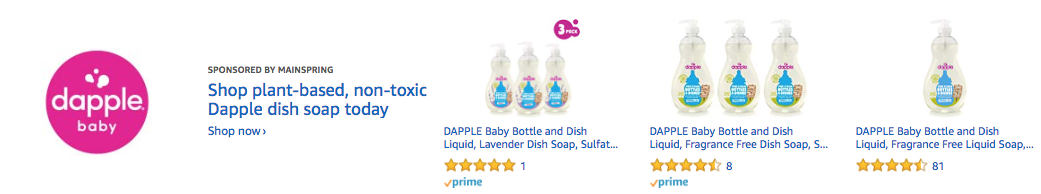 On the other hand, Dapple Baby’s plant-based, non-toxic dish soap may not be exactly what I’m looking for, but because its more eco-friendly centric products are in line with The Refill Shoppe’s it appears on the banner ad when I conduct my search. The key is using the right keywords and phrases and enough product descriptors. Who knows, there are plenty of people out there who will realize that they need this product
You might be thinking, why get into PPCs? Yes, it’s an investment of time and money, but with the expansion of the online marketplace and the less locals shop at brick-and-mortar storefronts, many small businesses can’t afford *not* to find new, alternative ways to sell products. But that entails going beyond simply selling on Amazon as a third-party seller; it would behoove companies to take advantage of PPCs. Bobsled Marketing writer Tom Crosthwaite shares this sentiment when it comes to the ever-growing online marketplace: “...it becomes more of a challenge to rank organically (even for established brands) due to the increased competition across every product category,” he writes. “By utilizing Amazon’s paid advertising tools a brand can rent pieces of prime real estate across the ecosystem in an attempt to gain more impressions, clicks and conversions. By not investing in PPC you are giving competitors an opportunity to eat into your market share. (“Winning on Amazon - The 4 Parts of the Bobsled Iceberg”). Additionally, Amazon is growing increasingly important to online shoppers. In fact, roughly 56% of Internet shoppers in the U.S., U.K., Germany, and France are relying on Amazon.com to begin their product searches. To put it simply, PPC advertising enhances the shopping experience for retailer and customer alike. Customers enjoy the benefits of easily discovering new products and brands thanks to advertisements that blend well with their searches while businesses enjoy a relatively simple targeted marketing strategy. By using this Amazon PPC proposal as a guideline for expanding The Refill Shoppe’s e-commerce presence, I am confident your company will be able to more rapidly influence the consumer market to adopt more sustainable habits, one product at a time.
0 Comments
Intro In this case study, I will be giving an overview of the independent coffee company Cali Roast’s conversion goals (the name “Cali Roast” is a substitute name I created for an actual client I perform light social media services for). Business Goal As a consumer goods business, the goal of Cali Roast is to sell its various coffee blends to loyal customers and new clientele. “Conversion” Defined Google defines “conversion” as “the completion of an activity that is important to the success of your business, such as a completed signup for your email newsletter (a goal conversion) or a purchase (a transaction, sometimes called an ecommerce conversion).” A conversion can be further categorized as “macro conversions” or “micro conversions.” A macro conversion usually pertains to an item or service that is bought, while a micro conversion can refer to a step that may come before a purchase, such as a social media “like” or signing up to receive a business’s e-newsletter. In the case of Cali Roast, the company’s sale of coffee products (beans, blends, merchandise, monthly/weekly coffee subscriptions, etc.) is its macro conversion. Its micro conversions include actions that may lead a consumer towards eventually making a purchase, such as sharing Cali Roast’s social media posts, placing products in an online cart, and following Cali Roast online. As is the case with most consumer goods companies, Cali Roast’s ROI (return on investment) can be measured by the amount of coffee products the business sells. SEO and user experience expert and Omni Marketing Interactive founder Shari Thurow outlines one example of the Marketing Funnel that applies to Cali Roast’s conversion steps from start to finish: Visit to ecommerce website → Product view → Beginning of checkout process → Purchase The macro conversion (sales of coffee products) are measured by the business’s chief operating officer(s) or financial personnel, whereas the more elusive micro conversions (page views, repeat visitations, social media activity, “likes,” comments, etc.) are measured by Cali Roast’s website/social media page administrators. Because web/social media analytics explain numerical data (all but the “why” behind a customer’s actions), all the above data is quantitative data. Qualitative data, such as why there are spikes in purchases during some months versus others, can be conjectured qualitatively. (Some) Data Below is a snapshot of Cali Roast’s Facebook user activity between November 1 and December 8. 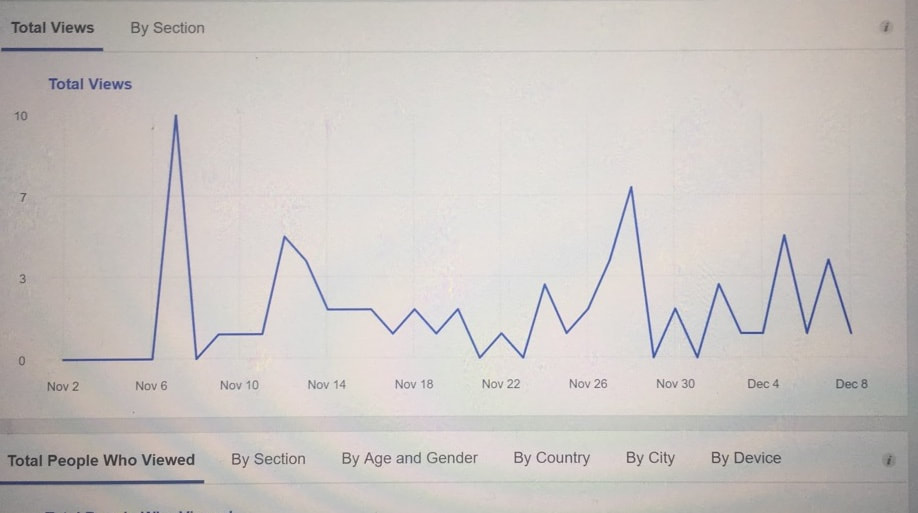 There are significantly higher periods of activity and page views on Cali Roast’s Facebook page in November than in December so far. This may have to do with the fact that there were more promotional sales publicized in November (a.k.a. Black Friday sales) than there will be in December. Therefore, Cali Roast should resolve to plan ahead and publicize its offerings more in the New Year. Target Audience Cali Roast, for the most part, targets consumers who are business owners or operators in the food services industry. Cali Roast does not have a cafe; it is solely a roaster and coffee manufacturer that sells its coffee to restaurants and grocery stores. To navigate to the conversion part of Cali Roast’s website, visitors will first go to the business’s home page. There, Cali Roast’s many different types of coffee are listed, along with photos of each product. Visitors can click on whatever type of coffee they want, be it South American blends, French roast, Californian coffee, and more. Customers have the option of choosing the type, amount, and quantity of coffee beans they want, and if they want it to be a one-time purchase or part of a weekly or monthly subscription. Once their items are added to their cart, they can check out and complete their purchase. Areas of Improvement Cali Roast uses excellent, high-quality images for its social media posts, as well as copy that clearly shows the voice of the brand. Here are a few of its Instagram posts:  However, the company could incorporate more calls-to-action into its posts by beckoning audience members to visit Cali Roast’s website. Overall, Cali Roast focuses more of its energy on the behind-the-scenes aspects of running a business than on its digital marketing plan. By setting aside time each month to engage more with customers, Cali Roast will grow its loyal following. Additionally, Cali Roast could take advantage of more audience engagement activities, such as photo/hashtag contests, and other promotions. The more Cali Roast rewards its loyal customer base, the higher ROI the company will experience.
Conclusion As is the case with most online businesses, the trick to a successful sale has to go beyond simply catching an Internet user’s attention, but holding it for long enough for them to make a sale. More than “likes” and follows, a consumer goods business’s benchmark for success is making a sale. However, getting a prospective customer from Point A all the way to Point E in the marketing funnel requires strategic planning. Firstly, customers must be aware of the business. Then ask yourself, “Why should X customer buy this product? Is it a good deal? Is it of high value?” Make your reasons evident to the consumer through your messaging. The business’s website must also be well-designed and easy to navigate. Call-to-action buttons must always stand out and be simple to find. As long as the checkout process is also simple, you have a higher chance of gaining repeat customers.
For this assignment, I've shared my thoughts (in the form of a slideshow) on how the e-book and audiobook streaming app OverDrive can be improved in terms of its mobile-friendliness and user engagement.
Ever since I began taking longer-than-average commutes to my job, I have become an avid audiobook listener. OverDrive is one of the audiobook platforms I use most often, and believe that by focusing on a few key metrics on its mobile app, OverDrive will be able to gain a more faithful following. This week, I’m delving into the market segmentation and key performance indicators for the American outdoor apparel brand, The North Face. I share on the three areas of market segmentation - segments, cohorts, and brand personas - as well as the importance of brand engagement, traffic sources, social media interactivity, and conversion rates in an online marketing strategy.
 A short anecdote to begin this blog: In an effort to improve my eating habits and make healthier food choices, I’ve lately been using the MyFitnessPal app to track my nutrition. After a series of Thanksgiving dinner first and second servings (and snacking in between), I happily reported to my sister, who’s aware of my health goals, that somehow, the scale didn’t go up when I weighed myself this morning. She said, “Well, you didn’t eat A LOT.” Which wasn’t quite true...I simply ate more of the better-for-you foods but not necessarily less food altogether. “It’s not really so much to do with the amount as the quality,” I told her.
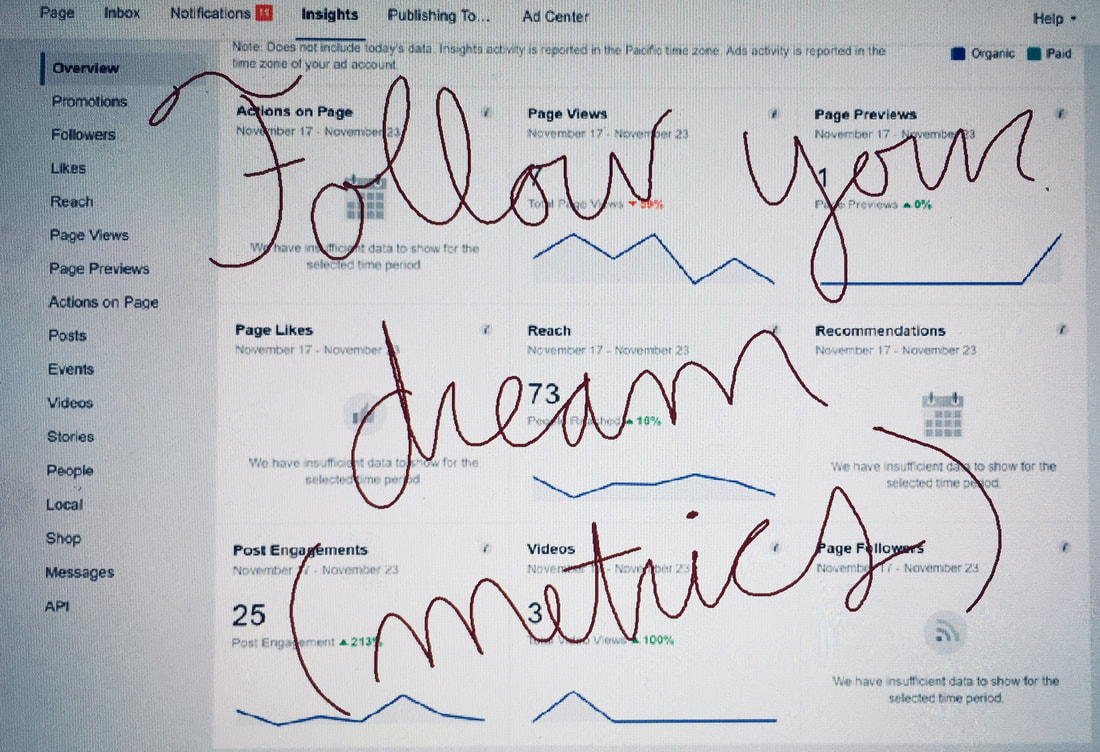
The same, “Quality over quantity” rule seems to apply in many facets of our lives, including social media management. The trick is to strategize smartly; not necessarily to gain X amount of followers, but to sustain X amount of followers for the long-term. Like nutrition, it’s not all about the number of calories consumed, but what you are feeding your body to benefit your health. In the Module 4 Web Analytics 2.0 video lecture, we reviewed the key metrics that most (if not all) social media managers use to determine the success of a campaign. They were listed in the following three categories: Audience - 1. Page Visits 2. Unique Visitors 3. Page Views 4. Bounce Rate 5. New Visits Acquisition - 1. Traffic sources 2. Referrals 3. Keywords Behavior - 1. All Pages 2. Landing Pages 3. Exit Pages All of the above are solid metrics, and useful for any organization, business, or social media campaign to keep in mind. Additionally, they all fall into social media expert Avinash Kaushik’s Four Attributes of Great Metrics (uncomplex, relevant, timely, and instantly useful). It’s helpful to get a general idea of how successful social media efforts are via page likes, re-shares, number of followers, etc. But what I’d consider my “dream” metrics are ones that go a bit beyond the obvious, combining the best of qualitative and quantitative information. The following is a brief list of a few dream metrics of mine, including explanations for each: Number of Followers - Over the Course of a Few Months Even though I just stated that number of followers isn’t the most important metric, it is crucial to see the ebb and flow of follower count over a substantial period of time. Social media managers must identify at what points of each month and which posts resulted in a significant increase or loss of followers. This is ‘instantly useful’ information as page managers will easily be able to determine which posts or strategies to replicate and which to abandon. Amount of Time Spent on Page/Bounce Rate Site views and visits don’t matter all that much unless they result in answers to calls-to-action (i.e. sales, subscriptions, and so forth). By identifying how long and on what pages a viewer spent the most time on, social media managers can see what they’re doing well, and what they may be doing wrong. In his article “Web Metrics Demystified,” Kaushik states that bounce rate (the number of followers who leave a website after viewing just one page) is an effective metric because it helps business owners see where their time, money, and energy may be wasted. He argues, “You can just look at (bounce rate) and know what needs attention, what needs to stop … You look at a page with 50% bounce rate and you know it needs attention. You see a campaign/keyword with 70% bounce rate and you know there is a fire.” Landing/Exit Page Activity Similarly, it’s important to know what may be compelling a visitor to exit prematurely from a website. In addition to seeing how much time was spent on landing and exit pages, social media managers must identify what factors might’ve encouraged this action. Was it a poorly constructed ad? Spelling errors? Too much technical language? Landing and exit page activity is one of my ‘dream metrics’ because it opens doors for page managers to change up their strategies and create ones that cause visitors to stay for longer. Most Effective Keywords Kaushik also explains that simply knowing what a site’s keywords are isn’t enough; managers need to know which ones pack the most punch: “Anyone can tell you what your keywords were this month, or last month,” he writes. “The ClickTracks reports shows you ‘what you should care about,’ keywords that rose in their importance this month and which ones reduced in importance." Google Analytics or similar metrics tools can measure the effectiveness of certain keywords, letting social media managers know which keywords to build their marketing strategies around. Traffic Sources If Internet users are drawn to a website through a Facebook ad, a Google search, or a Tweet, social media managers best put their marketing strategies to use on the platforms where their target audience is spending the most time. It’s not enough to simply know where views are coming in from; knowing the traffic sources becomes a dream metric when page managers use this information to generate more activity in the places they know their audiences are. 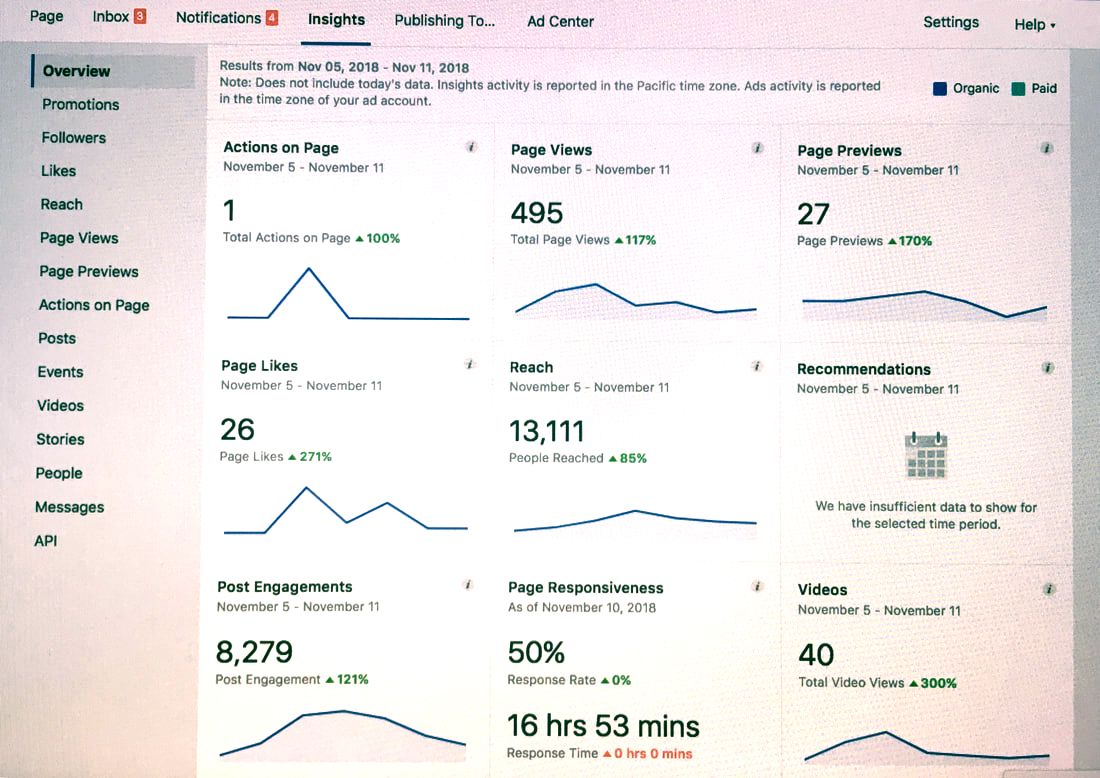 When it comes to metrics, Facebook's easy-to-use interface reigns. As you seek out social media tools that will best track the success of your business’s digital presence and engagement, you will want a comprehensive solution that will provide you both the proof in numbers as well as the opportunity to perform qualitative analysis to support your conclusions. In short, you want the tool that will help you increase engagement, brand awareness, and perhaps most importantly, sales.
In an effort to provide the best social media listening tool for your business, I propose taking a look between the two social media analytics measurement tools, Facebook Insights and Sprinklr Business Index. Facebook Insights: If choosing to use your Facebook business page’s built-in measuring tools, it’s certainly a convenient way to go rather than outsourcing your metrics analyzing to another app/tool. The main pro of using the Facebook business page/Insights to track quantitative metrics for your organization is that it is *largely* free, unless you decide to use the “boost” feature or incorporate ads. Facebook Insights provides the basics - you can see how many actions took place on your page, page views, page likes, reach, post engagements, page responsiveness (especially useful for businesses that are trying to improve their response time to customers), and page followers. You can filter these types of data to see what kind of activity your page saw over one day, two days, a week or a month. The interface will allow users to see which posts experienced the most engagement, showing more than just the number of likes, but also the type of reaction the post received (a post click versus reactions, comments, and shares) and whether a post’s reach was the result of a organic search or a paid advertisement. Moreover, Facebook Insights allows businesses to see what times are optimal for publishing posts (as you are able to see at what time of day posts experienced the most activity) as well as what regions of the world your followers are located. This allows businesses to cater to their viewers’ interests by making their social media strategies reflect trends and topics their viewers are more likely to tune into. Additionally, Facebook Insights provides useful information like Pages to Watch, so that organizations can see data from similar businesses or competing businesses; net likes, which show how many followers you’ve gained and lost throughout the week; and actions, or how many people followed your call to action to visit your website or call your business’s phone number. One of the cons of using Facebook’s business page to analyze your social media following may have to do with your target audience. If you’re marketing to a generation that does not use Facebook often or does not use it as a their preferred social media platform, Facebook Insights won’t give you an accurate reflection of your customer base. Additionally, you may need to create or increase your advertising budget in order to drive traffic to your Facebook page, especially if your business is in its early growth stages. And of course, having any sort of social media page for your business at all means that your business will need to create a protocol for dealing with negative feedback from your audience. After all, social media is a two-way communication street. And finally, unless you look at the reactions associated with each of your posts, there’s no easily accessible percentage ratio showing positive to negative reactions your posts or page are experiencing. Sprinklr Business Index: Sprinklr Business Index (SBI) prides itself in measuring and analyzing “the breadth of public interactions between brands and consumers across social media.” Like Facebook Insights, SBI tracks a brand’s performance based by measuring audience size, content engagement, and responsiveness of a brand to its customers using publicly available data (i.e. social media posts). SBI will use current data and compare it to a brand’s performance dating back to 2012. What’s more, SBI users can compare the performance of their brands to competitors to identify areas of improvement. SBI calculates a few different categories for a brand’s overall engagement scores. Its Content Score is measured by looking at a brand’s published messages per account and engagements per post. Audience scored is determined by number of followers per account, total mentions, and estimated reach per post. Care Score is determined by the percentage of messages a brand responds to and how long it takes for them to respond. I believe SBI provides some valuable insight that Facebook Business does not, such as overall brand sentiment, popular key words that resonate with audiences, and a comprehensive comparison feature that allows one to see how well their social media strategy is compared to a competing company. The big con is its monthly subscription pricetag, which runs around $100-$250 a month depending on what type of program you purchase. Additionally, the information SBI gives regarding audience insights may not always be accurate, and it may not pick up user insight data from ALL the social media platforms that are out there. The Winner: Because Facebook is the most commonly used social media platform, I am declaring Facebook Business the winner over SBI. If you’re a business, you should have an active Facebook page anyway, which is free. If you tend your garden, you'll grow your social media following over time and have the metrics and insight you need to see where you can improve in your business's social media strategy and increase customer engagement. And, if you can spring a few bucks towards digital advertising, you might reach your social media goals that much faster. However, I also like the SBI platform because it provides some useful components that Facebook Insights does not yet have (top key words, brand sentiment, etc.). But it is certainly the costlier route to go. Because both tools provide *most* of the same data about their audiences (the most important ones are listed in this Hootsuite article by Eddie Shleyner), using Facebook’s business page is the more cost-effective way to go. Don’t spend more than you need to; use the bulk of your funds to do what you do best - providing a product or service to your clientele. According to Kim Lachance Shandrow’s Entrepreneur article “10 Questions to Ask When Measuring Your Social Media ROI,” the easiest way to measure social media success is by looking at the number of conversions or answers to you calls-to action. There’s a wealth of social media measurement tools out there (many of them free). As long as you are able to accurately gauge how well your audience is responding to your content using the basic metrics, celebrate your victories and keep building on you social media strategy before advancing to higher-tier social listening tools. Brand: Founded in 1966, The North Face is a an American outdoor apparel and equipment company based in Alameda, California. The company sells a variety of products for the intrepid adventurer, including outerwear, backpacks, tents, and other camping gear. The North Face is an advocate for nature conservation and prides itself in inspiring “a global movement of exploration.” Brand sentiment: Using the social media monitoring tool Social Mention, we get insight on how well The North Face is received by its audience by analyzing what is being said about the company on various social media channels, blogs, comments, news reports, etc. in real-time. According to Social Mention, The North Face has a positive to negative sentiment ratio of 5:1 (this ratio was recorded as of 8:05pm on November 7, 2018). This means that by and large, The North Face is experiencing mostly favorable attitudes from its customers. However most of the brand sentiment is neutral, perhaps due to the fact that many of the posts that tag The North Face are photographers who are simply wearing or using the company’s gear. Sprinklr Business Index reports slightly different sentiment analysis results. As of 8:51pm on November 7, 2018, The North Face received 183 positive mentions on social media since October 31 and 54 negative mentions over the same time period. Social campaign initiative: As part of its mission to inspire audiences to explore the nature around them, The North Face began utilizing the hashtag, #neverstopexploring, which also serves as the company’s mantra. The phrase “Never Stop Exploring” also refers to the company’s speaker series in which The North Face athletes host presentations in various cities. More than a social campaign initiative, #neverstopexploring is a way for The North Face’s followers and customers to both market the company’s gear and show off their adventures to their respective followers. The hashtag has a dual purpose: Images of young outdoorsy people kayaking, rock-climbing, hiking, and mountain biking make followers want to get out in the great outdoors. Additionally, it makes them want to do these activities while wearing The North Face products. Quantitative and Qualitative analysis: Sprinklr Business Index provides content and audience insights to determine how engaging a business’s content is and how well it is received by followers. Content-wise, The North Face enjoys a healthy average daily engagement (likes, comments, shares) of 17.3K, or 3.7K responses per post. The North Face on average generates about five posts every day. If you compare The North Face’s stats to similar brands like Athleta (which only posts twice a day and experiences less than a third of The North Face’s daily engagements), the company is in a healthy position. 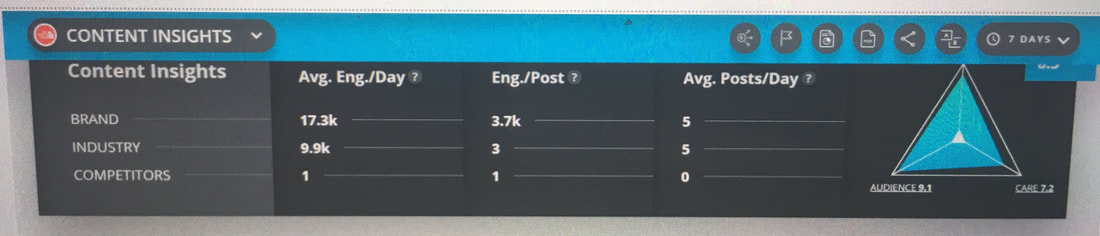 While The North Face’s performance insights do share numbers (the brand gets about 118K likes, 763 comments, and 160 shares per content type), the data also reveals more qualitative information, such as what sort of content proves to resonate the most with audiences. The North Face’s videos, judging by the below chart, enjoy the most engagement from viewers, followed closely by photos. In the “Avg Engagement Per Topic” section, we observe that content that revolve around photos/imagery and holiday gifts are gaining the most traction. 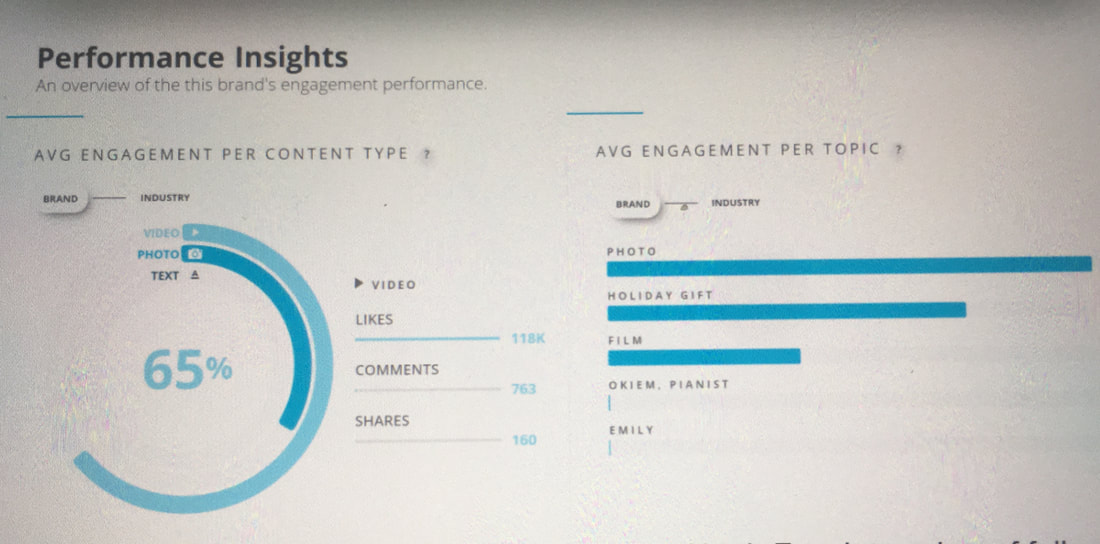 Here is more quantitative information showing The North Face’s number of followers (7.3M), reach rate (11%), and engagement ratio (a little over 2%). But the qualitative analysis comes in when we think about how effective current digital marketing strategies are when trying to increase the number of reaches and engagement. 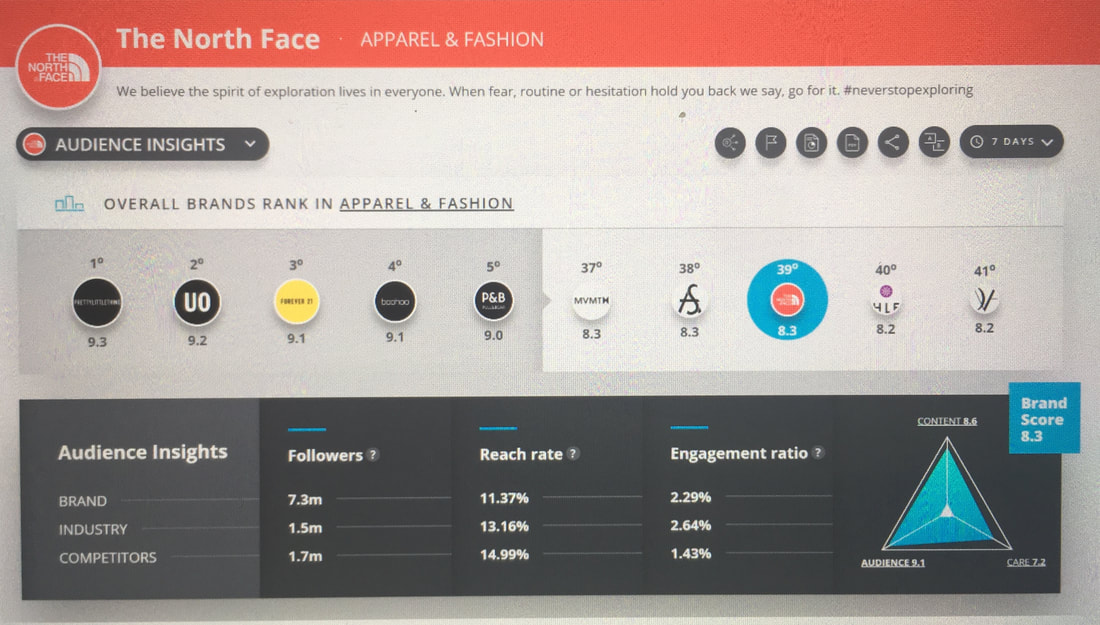 Below, we see numerically how The North Face has grown over the last few days, but qualitatively, we may determine that this is due to the approach of the holidays and with it, holiday shopping. Again, brand sentiment numbers show us how much an audience likes a business as a certain point in time, but through qualitative analysis, a brand manager will think about the “whys” behind the numbers - Why are certain customers negatively responding to our posts? How does it compare to The North Face’s competitors, or the outdoor gear industry as a whole? On what platforms is The North Face receiving negative feedback? 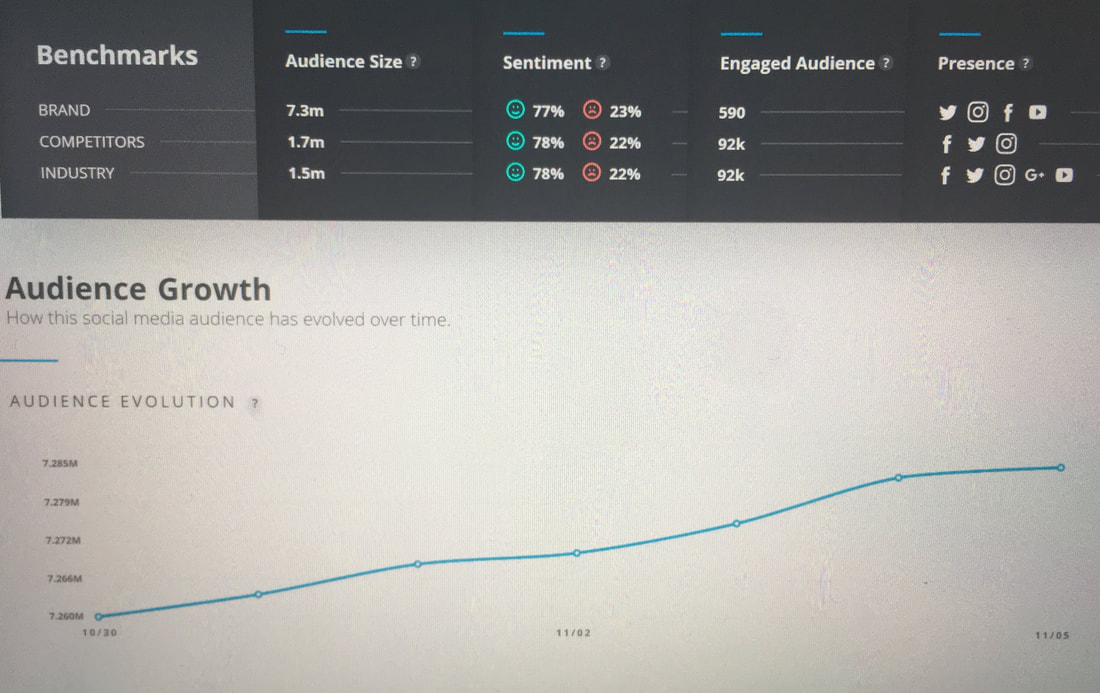 ROI: Lastly, the success of a brand/brand campaign can be determined by its return on investment, or ROI. Kim Lachance Shandrow writes in her article, “10 Questions to Ask When Measuring Your Social Media ROI” that the easiest numbers to defer to when tracking social media success is by looking at the number of conversions (which can be determined using the paid versions of tools like Sprinklr Business Index). But, she argues, being preoccupied over vanity metrics like number of followers and “likes” is a waste of time. However, it appears that The North Face has been able to keep its existing followers and increase its following, which indicates that the company is doing well to keep its loyal customer base engaged and likely to be able to convert current followers into paying customers. Shandrow writes, “The more you engage your followers, the more they’ll share your content, which will hopefully lead to more conversions and possibly sales.”
This week, I’m outlining the pros and cons of the web analytics tools Google Analytics and Tableau.
To Whom It May Concern: As business managers, you are aware that data and numerical proof of your digital marketing campaign’s success are key components to identifying goals and understanding where areas in your organization can be improved. But just as important as making quantitative determinations is being able to qualitatively assess your current social media tactics and see if they can be replaced by better strategies. No doubt you’ve researched various web analytics dashboards/tools that will best serve the interests of your digital marketing goals and measurements. You want a tool that will show you the page views, bounce rates, number of unique visitors, optimal keywords, sources of traffic, and much more. But equally important is the “why” behind the results you see. There is a myriad of apps and tools that allow you to see the numbers, but what platforms will also help you identify what actions can be made to drive more traffic to your website and increase your conversions? I’ve weighed the pros and cons of the two analytics tools, Google Analytics and Tableau, in hopes of alleviating the pressure you may have encountered trying to make the best decision for your company’s digital marketing plan. Here are two simple pro/con lists that give brief overviews of each platform’s strengths and weaknesses: Google Analytics Benefits:
Disadvantages:
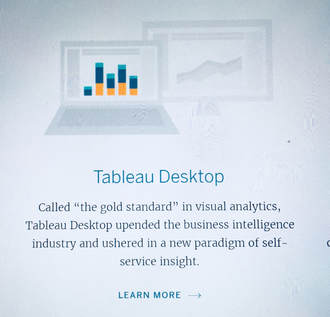
Tableau Benefits:
Disadvantages:
My initial inclination would be to use the tried and true method, Google Analytics. For one thing, it is the more economical option and has name recognition. But if your budget will allow it, Tableau may be the better choice if you’re seeking the chance to analyze the various moving parts that come with full, comprehensive web metrics. Because Google Analytics is free, it is limited as far as showing full website visitor activity. Tableau, on the other hand, provides more visual options, categorizes visitor posts that mention your brand (and if their comments were positive or negative in nature), and provides more accurate, up-to-the-minute data. To wrap up this proposal, I end with some words from author and digital marketing evangelist Avinash Kaushik’s essay, “The Biggest Mistake Web Analysts Make...And How To Avoid It!”. He argues that a big part of an impactful web marketing strategy is ensuring that your measurable outcomes are instantly actionable. The fastest way one can positively impact their business is by using insights from their analyses (in this case, web metrics) to make improvements. Kaushik writes: “...you are looking for big, obvious broken things that can mostly likely be fixed quickly and for which the impact can be quickly measured. You are trying to find something with a clear purpose to show the power of actions taken through data.” With that, I wish you all the best in your digital marketing journey. 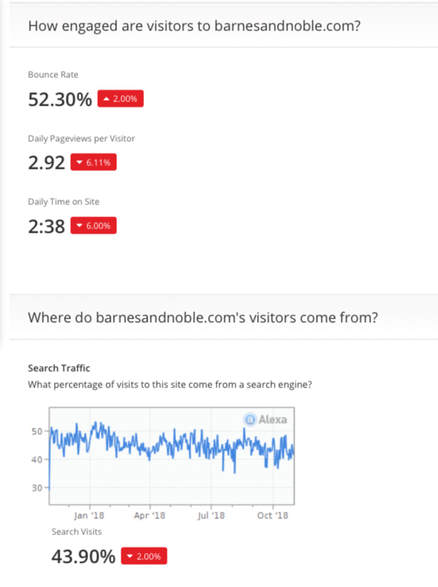 Just a snapshot of Barnes and Noble web metrics Author and digital marketing “Evangelist” Avinash Kaushik outlines in his commentary “Web Metrics Demystified” his four main criteria for metrics that are effective and mostly evergreen - Uncomplex, Relevant, Timely, and Instantly Useful. The specific metrics themselves - page views, bounce rates, etc. - might mean more for one company than it does to another but as long as the individual metrics stay true to the above four criteria and help improve the quality of a business’s digital marketing, they’re safe to use. In my time both as an interactive media student and burgeoning digital marketer, I’ve learned that social media metrics are not one-size-fits-all. Every business is different; what proves successful for one organization may not be a strong strategy for another. For example, a business that markets to a Baby Boomer generation would be smart to focus their marketing efforts on platforms that they spend the most time on (not Snapchat or Twitter). It was difficult to choose the metrics I feel are most important for this brief case study of Barnes and Noble’s web metrics. Nevertheless, I’ve ranked them as follows (refer to the metrics via this link if you wish to follow along: https://www.alexa.com/siteinfo/scholastic.com): 1. Visits Visits, at their very core, tell us how many people visited a website. It’s usually safe to assume that most of the visitors came to a page intentionally, either due to their own curiosity, or through an ad or referral. Of course, some visitors could’ve navigated to the site due to an accidental click, but the numbers of visits give social media managers a fairly good idea of how many people are interested in their website on a given day. The importance of the number of visits a site receives is, in my opinion, closely followed by the amount of time one spends on a website. As of now, Barnes and Noble enjoys a little less than three pageviews per visitor per day (unfortunately, I don’t have a premium Amazon Alexa plan and don’t have access to how many total pageviews B&N has each day). 2. Bounce rate A bounce rate percentage details how many website visitors leave a site after viewing just one page. This is also important because it can correlate with the quality of a marketer’s content. The higher the bounce rate, the more likely it is that a business needs to rethink its marketing strategies and/or their website’s aesthetic quality. The content of a website must be relevant, eye-catching, creative, and engaging to a potential client or customer. B&N has a bounce rate of roughly 52%, meaning that B&N’s products may not necessarily appeal to most of their audience at this time, or that B&N needs a website refresh. 3. Traffic sources Where website visitors come from is crucial for organizations to know if they want to improve their marketing strategies or identify which traffic sources to focus on. For B&N, its top upstream sites include (in order) Google, Amazon, Yahoo, Facebook, and Bing. That means B&N may put more time and energy into generating ads for these five sites’ rather than putting the same amount of effort into less popular upstream sites. Another strategy would be identifying keywords that’ll boost B&N’s SEO, which leads me to my next point... 4. Keywords Knowing what words and phrases draw in the most website visitors shapes the work content creators do. Since the vast majority of B&N’s site traffic was generated by keywords like “Barnes and Noble,” “books,” and “Nook,” the copywriters who draft content for the product pages or B&N’s blog, “Barnes & Noble Reads,” will incorporate these words into their copy as much as is reasonably possible. 5. Landing page The landing page of a website very much relates to an organization’s bounce rate. Having an ad that is successful enough to be clickable is all well and good but doesn’t mean much if that visitor is disappointed by your landing page and quickly decides to navigate away. Again, having compelling content, as well as having an easy-to-navigate website, are just a few components that contribute to a website’s overall success. The magic happens when a visitor is converted into a buyer, or refers your products/services to someone else. 6. Exit page I don’t feel that an exit page (the last page one visited before ultimately leaving a website) is necessarily as important as the landing page but it does have value. If you have a high bounce rate, a step you can take to remedy this is to evaluate the content of the exit page(s) and see where you can make certain products or services look more valuable to your customer. But don’t pressure your customer into buying. It’s possible that the purchase process or the user interface may be too complicated for your audience to continue using. 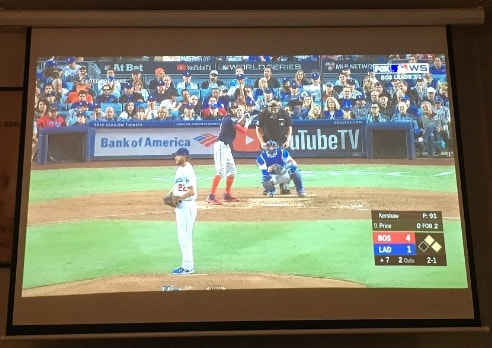 Root, root, root for the Dodgers... In my last post, I discussed how the adage “Quality over quantity” has become such a commonplace phrase, that it’s often used as a justification for why some of us don’t have more than 50 friends, haven’t dated X amount of people by age X, or don’t have more than two pairs of jeans hanging in our closets.
However, this isn’t to say that quality always trumps quantity. In fact, I’m confident that qualitative nor quantitative data is necessarily “better” than the other. In his article “Qualitative Analytics: Why numbers do not tell the complete story,” author Anmol Rajpurohit argues that people tend to resort to their “gut feeling” and favor one type of method (qualitative vs. quantitative) over the other. Numbers-focused data shows what the “what” behind a trend - how many people participated in X behavior, how much time they spent on a certain activity, how much money they put towards a product or service, and so on. But as Rajpurohit argues, quantitative data doesn’t give the entire picture. He writes, “Qualitative analytics includes the analysis of context, human behavior, emotions and other factors that are hard to digitize without losing any meaning … it is also a great tool to bridge the gap between insights provided by quantitative research, and provide in-depth understanding of the underlying reasons and motivations for a phenomenon.” Take, for example, the MLB World Series**. Last night, I watched the Boston Red Sox dominate the L.A. Dodgers in their fifth game by 5-1. By the start of yesterday’s game, Boston was already enjoying a three wins over the Dodgers before clinching their fourth victory, and their eighth World Series champions title. **For the record, I am NOT a regular sports watcher; I was simply using the information I had in front of me to determine what the overall outcome would be. As a California resident, I felt obligated to root for Dodger Blue but based on how the past four games went I used the quantitative data I had (a.k.a. the past scores, each player’s batting averages, number of home runs, etc.) to predict how well I thought the Dodgers would perform in the fifth game. In the end, my prediction was right. The proverbial nail in the coffin came when Sox hitter Steve Pearce hit his second home run in the eighth inning, putting the final score at 5-1. I’m no sports analyst. But I imagine that the sports reporters and statisticians whose job it is to dissect every facet of the games they watch, as well as each player, don’t rely on the numbers alone. They’re also evaluating - qualitatively - what other factors might’ve played into the outcome of the game beyond the statistical data. They’re looking at the possible impact of home field advantage (which of course did nothing to help the Dodgers yesterday), the experience level of the players, what errors contributed to bad plays, and opportunities that certain players might have used to steal a base or swing for the fences. (Note: This New York Times play-by-play of Game 5 is a great resource that shows how exactly the Red Sox won the World Series by analyzing each inning.) Sean Donahue, founder and CEO of Context Strategies, writes in his commentary “The Big Data Craze Is Just as Qualitative as It Is Quantitative” that most businesses, government entities, and other organizations don’t put enough emphasis on the “why” behind a trend: “It’s easy to rest on our laurels when the obvious answer might appear to be right in front of us,” Donahue says. “But disrupting the status quo is just as qualitative as it quantitative - in this case, it’s the only way that we make big data work.” When used in conjunction, quantitative and qualitative can prove to be a home run for organizations that use and apply the information gleaned from both types of data analysis. |